Note
This tutorial was generated from a Jupyter notebook that can be downloaded here. If you’d like to reproduce the results in the notebook, or make changes to the code, we recommend downloading this notebook and running it with Jupyter as certain cells (mostly those that change plot styles) are excluded from the tutorials.
Demo - SNR evolution over time
This demo uses LEGWORK to show how we could track the SNR of a source if we observed it at different times
[2]:
import legwork as lw
import numpy as np
import astropy.units as u
import matplotlib.pyplot as plt
[3]:
%config InlineBackend.figure_format = 'retina'

plt.rc('font', family='serif')
plt.rcParams['text.usetex'] = False
fs = 24

# update various fontsizes to match
params = {'figure.figsize': (12, 8),
          'legend.fontsize': fs,
          'axes.labelsize': 0.7 * fs,
          'xtick.labelsize': 0.6 * fs,
          'ytick.labelsize': 0.6 * fs,
          'axes.linewidth': 1.1,
          'xtick.major.size': 7,
          'xtick.minor.size': 4,
          'ytick.major.size': 7,
          'ytick.minor.size': 4}
plt.rcParams.update(params)
To start we can define the initial parameters of the source and work out how long it will take until it will merge.
Feel free to change these values to see how the plot changes!!
[4]:
m_1 = 15 * u.Msun
m_2 = 15 * u.Msun
dist = 20 * u.kpc
ecc = 0.5
f_orb = 3e-5 * u.Hz
[5]:
t_merge = lw.evol.get_t_merge_ecc(m_1=m_1, m_2=m_2, ecc_i=ecc, f_orb_i=f_orb)
Next we can evolve the system up until a 100 years before it merges with 1000 timesteps and record the eccentricity and frequency evolution as well as the timesteps.
[6]:
ecc_evol, f_orb_evol, timesteps = lw.evol.evol_ecc(m_1=m_1,
                                                   m_2=m_2,
                                                   ecc_i=ecc,
                                                   f_orb_i=f_orb,
                                                   t_evol=t_merge - 100 * u.yr,
                                                   avoid_merger=False,
                                                   output_vars=["ecc", "f_orb", "timesteps"],
                                                   n_step=1000)
We then take these evolved values and treat them as different sources that occur at different times and calculate the SNR for each one.
[11]:
source = lw.source.Source(m_1=np.repeat(m_1, len(ecc_evol)),
                          m_2=np.repeat(m_2, len(ecc_evol)),
                          dist=np.repeat(dist, len(ecc_evol)),
                          ecc=ecc_evol,
                          f_orb=f_orb_evol, interpolate_g=False)

snr = source.get_snr()
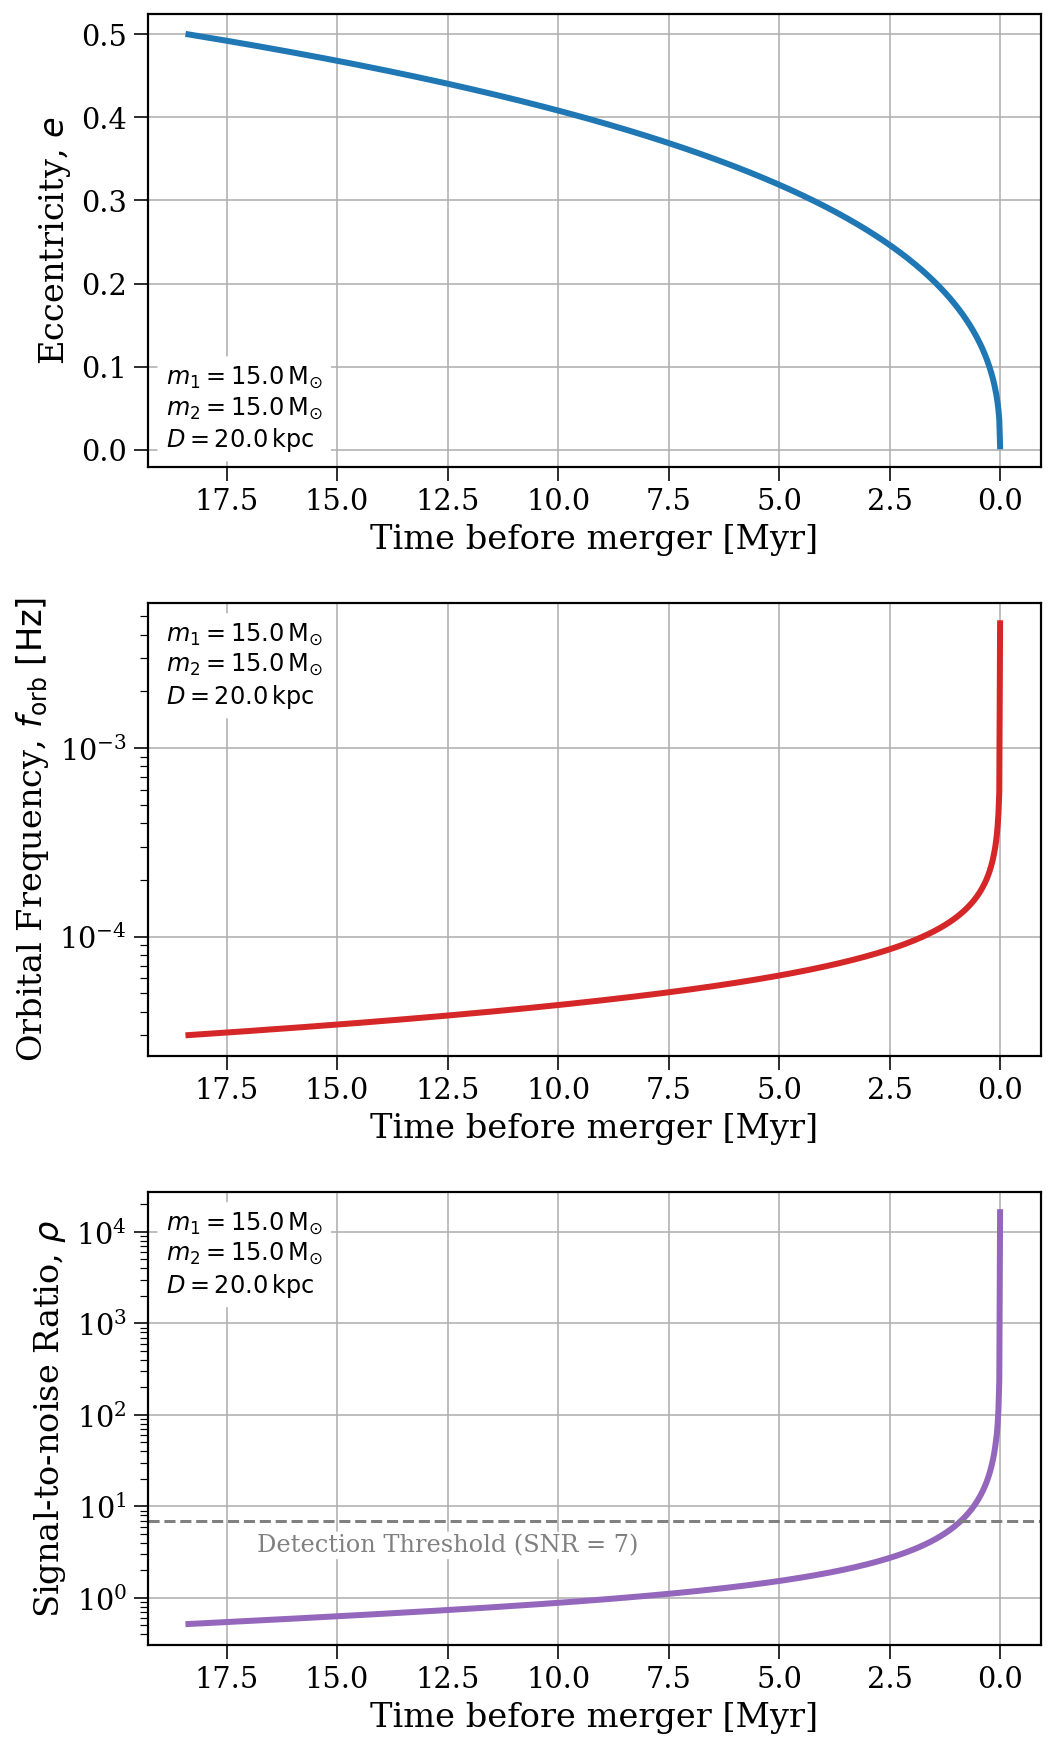
Now we can plot the results! Let’s compare how the eccentricity, frequency and SNR change as we approach the merger.
[12]:
fig, axes = plt.subplots(3, 1, figsize=(8, 15))
fig.subplots_adjust(hspace=0.3)

# calculate the time before the merger rather than timesteps
t_before_merger = (t_merge - timesteps).to(u.Myr)

# plot the eccentricity
axes[0].plot(t_before_merger, source.ecc, lw=3)
axes[0].set_ylabel(r"Eccentricity, $e$")

# plot the frequency on a log scale
axes[1].plot(t_before_merger, source.f_orb, lw=3, color="tab:red")
axes[1].set_yscale("log")
axes[1].set_ylabel(r"Orbital Frequency, $f_{\rm orb}\ [\rm Hz]$")

# plot the SNR on a log scale
axes[2].plot(t_before_merger, source.snr, lw=3, color="tab:purple")
axes[2].set_yscale("log")
axes[2].set_ylabel(r"Signal-to-noise Ratio, $\rho$")

# add a line to indicate the detection threshold
axes[2].axhline(7, color="grey", linestyle="--")
axes[2].annotate("Detection Threshold (SNR = 7)", xy=(12.5, 5), ha="center", va="top", fontsize=0.5*fs, color="grey",
                 bbox=dict(boxstyle="round", fc="white", ec="white", pad=0.05))


params_string = r"$m_1 = {{{}}}\,${:latex}".format(m_1.value, m_1.unit)
params_string += "\n" + r"$m_2 = {{{}}}\,${:latex}".format(m_2.value, m_2.unit)
params_string += "\n" + r"$D = {{{}}}\,${:latex}".format(dist.value, dist.unit)

for ax in axes:
    ax.set_xlim(reversed(ax.get_xlim()))
    ax.grid()
    ax.set_xlabel("Time before merger [Myr]")
    ax.annotate(params_string, xy=(0.02, 0.96 if ax != axes[0] else 0.03),
                xycoords="axes fraction", va="top" if ax != axes[0] else "bottom",
                fontsize=0.5*fs, bbox=dict(boxstyle="round", fc="white", ec="white"))

plt.show()